 Rebound
 Rebound
Reports and the report builder
Reports answer common questions about a site at a glance. Use the standard reports, or build your own without writing SQL.
Applies to: Rebound 2.0 (saving custom reports needs Pro) · Rebound plugin 2.0 (free)
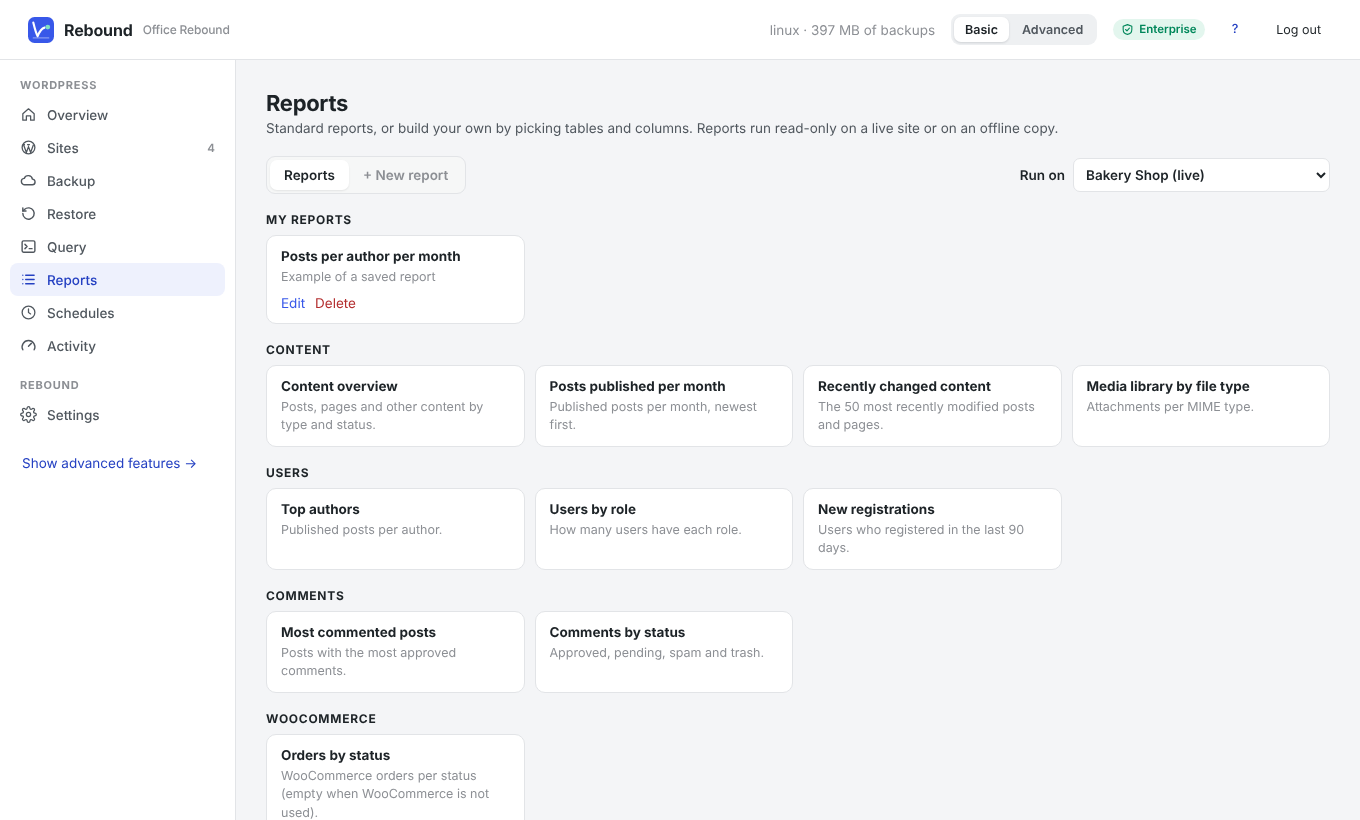
Standard reports
| Group | Reports |
|---|---|
| Content | Content overview, Posts published per month, Recently changed content, Media library by file type |
| Users | Top authors, Users by role, New registrations |
| Comments | Most commented posts, Comments by status |
| WooCommerce | Orders by status |
| Health | Autoloaded options, Largest autoloaded options, Clean-up candidates, Active plugins, Largest tables |
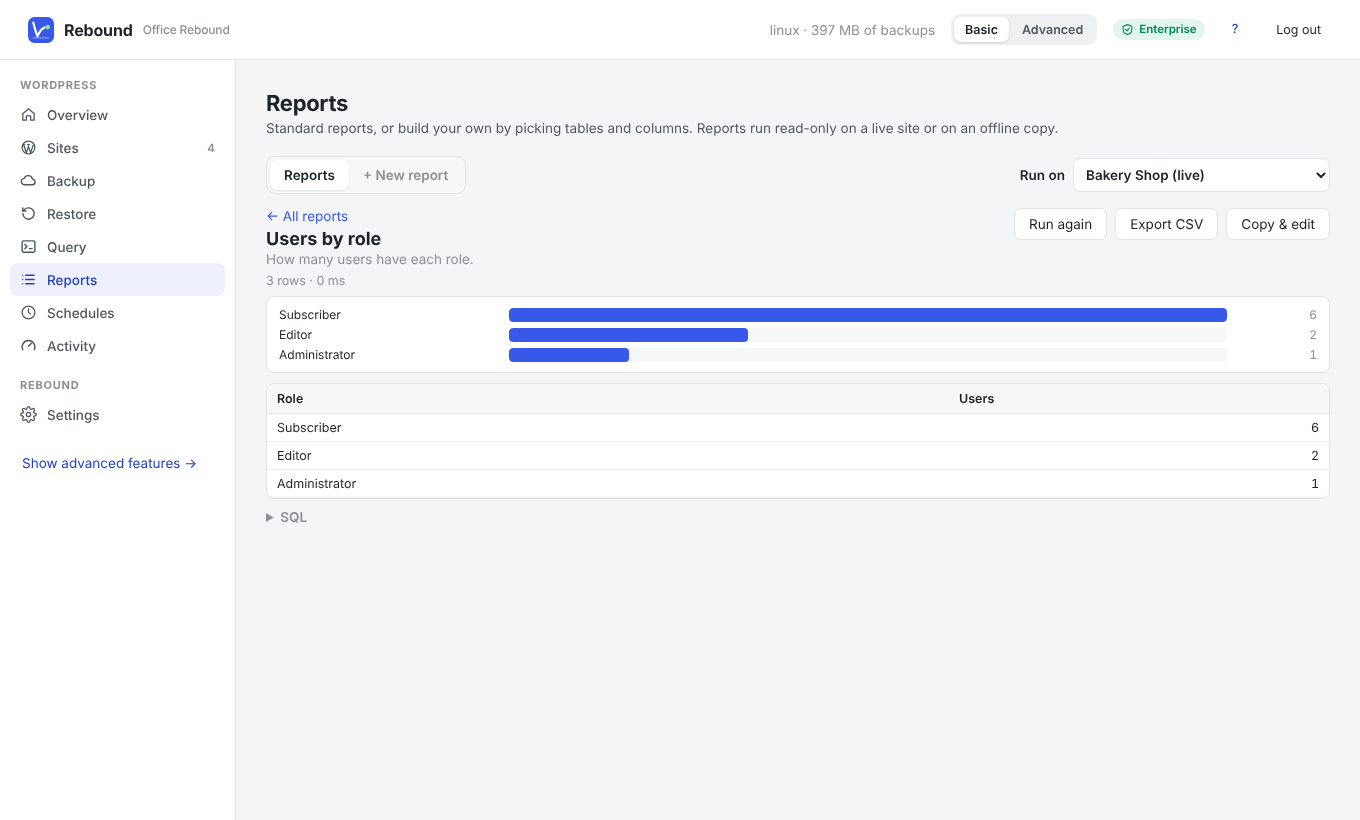
Choose Run on at the top to run a report on another site or on an offline copy. Results can be exported as CSV; numbers are shown as a bar chart.
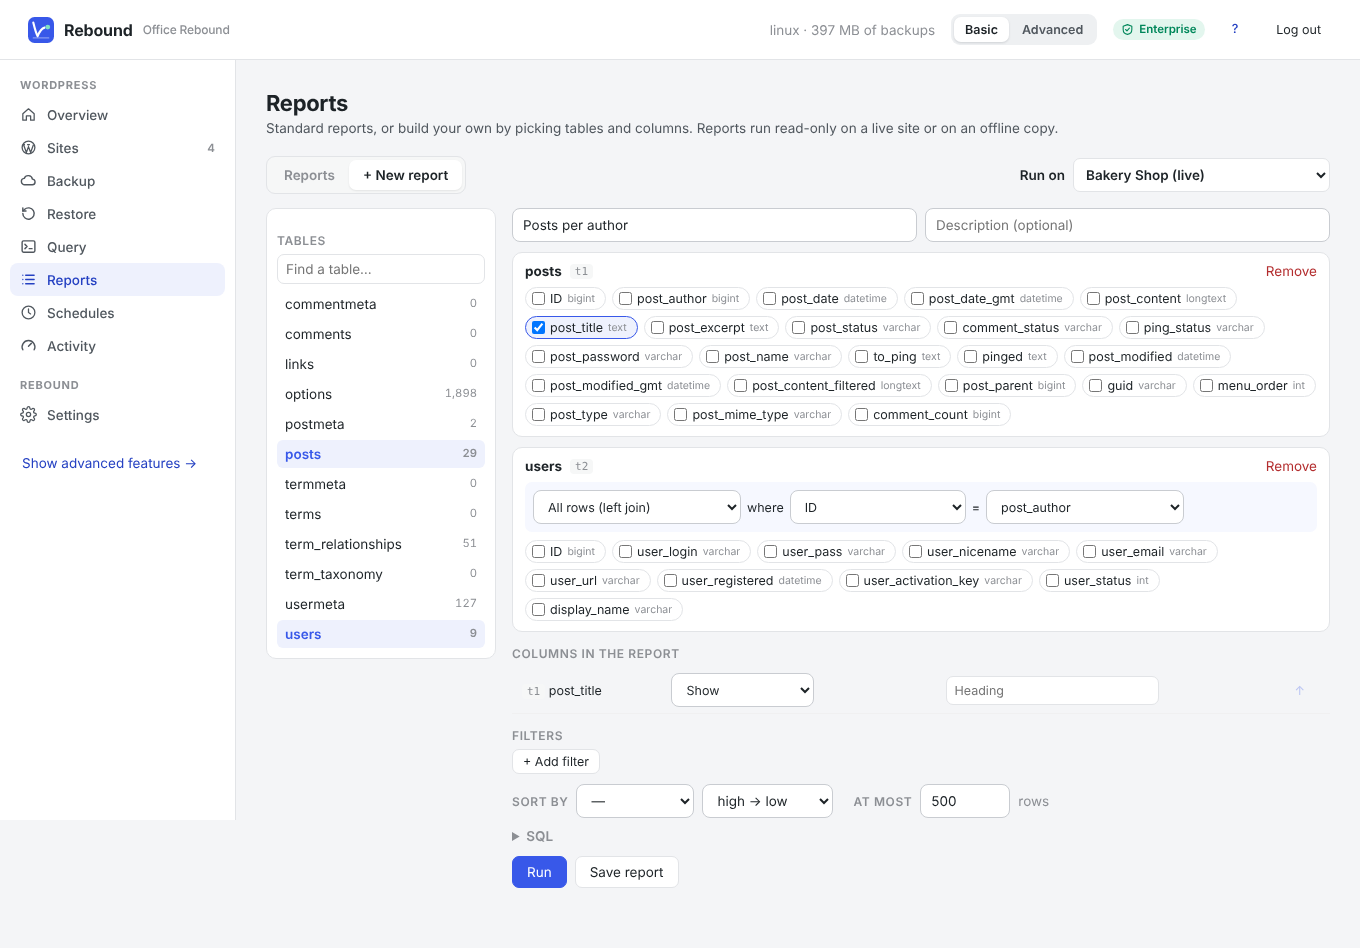
To build a report
- Click + New report.
- Click a table on the left (for example posts). Click another table (for example users) to combine them — Rebound suggests how they connect (post_author = ID). You can change the join.
- Tick the columns you want.
- For each column choose Show, Group by, or a summary: Count, Count distinct, Sum, Average, Minimum, Maximum. Date columns can be grouped per day, per month or per year. Give columns a heading if you like.
- Add filters (is, contains, starts with, is empty, in the last … days, …), a sort order and a row limit.
- Click Run, then Save report and give it a name.
Saved reports appear under My reports and can be run on any site: table names are stored without the site's table prefix.
ℹ
Note In Advanced mode you can also edit the SQL the builder writes.